Monthly Archives: October 2016

Business Blog No 34 – Q1 Cashflow Statement

This is the third part of a four-part series looking at the first quarter results of the 2016/17 financial year.  Previously, we have looked at the Profit and Loss and the Balance Sheet Reports. This week we look at the Cashflow Statement and undertake a quarterly review of your actual Q1 results compared to the budget and prior year.

Your Accountant or CFO or Virtual/Part-Time CFO should be providing you with your management reports and analysis within a week following month-end in a concise but comprehensive slide deck of six or seven slides/pages. The Cashflow Statement will be one of the slides in the slide deck, which should be presented and discussed at your management review meeting.

In relation to the last two newsletters, it is interesting, but not surprising, to note that the Profit and Loss Statement newsletter received 30% more ‘reads’ then the Balance Sheet newsletter. The pre-occupation with profit is understandable, but Balance Sheet management is just as important as Profit and Loss achievement.

CASHFLOW STATEMENT

I suspect that this newsletter with get less ‘reads’ than the Balance Sheet newsletter, but it really is a key part of this trio of management reports. The Cashflow Statement pulls the Profit and Loss Report plus the Balance Sheet report together to show how the movement in cash balances has occurred during the quarter.

Cash of course is the key number for SME’s, without it, your business will certainly fail, hence the importance of the Cashflow statement cannot be understated.

blog-34-cashflow

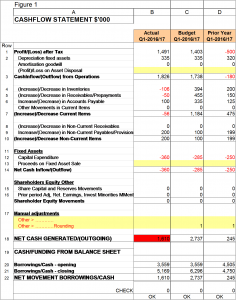
Back in Newsletter 20, you created your Budget Cashflow Statement. Using that same format, below is an example of a Cashflow Statement slide showing actual values/movements for the Q1/2016-17 (Column B), Budget for Q1 (Column C) and then the prior year Q1 actual values (Column C); refer Figure 1 below. Graphs and charts can also be used for illustration purposes.

Each variation exception should be reviewed by your Accountant or CFO in the first instance comparing budget and prior year figures and flagging variances/issues. TIP: I use a colour code system of RED (PROBLEM), ORANGE (WARNING) and GREEN (GREAT) as an effective flag for exceptions (refer Figure 1).

By understanding the assumptions on which the budget Profit and Loss and Balance Sheet numbers have been derived, you should be able to understand why your actual Bank Balance figure vary to the budget. At a macro level, in the example I have used over the last two newsletters, we achieved higher than budget profit, and yet our cash balances are well short of budget. The reason for this is we are carrying excess inventories, our Accounts Receivables balances are higher than budget and we are spending in capital faster than budget. Refer Figure 1 below. Actions should be taken to address these issues clearly.
blog-34-cashflow-statement

SUMMARY

Use this week to understand and analyse your Cashflow Statement for Q1 as it is the lifeblood of your business and provides a sound foundation for business success.

NEXT WEEK

Next week will move to the fourth Q1 report, Forecast Report.

WE HAVE MOVED

We have recently moved from our Dandenong South location to be more central to our client’s locations. You will now find us at Ground Floor, 203-205 Blackburn Road, Mount Waverley, VIC, 3149. Our new phone number is (03) 9847-6834. As always, if you need any help or want a no obligation chat, don’t hesitate to contact us.

Ross – Billson Advisory

Business Blog No 33 – Q1 Actual Balance Sheet

This is the second part of a four-part series looking at the first quarter results of the 2016/17 financial year.  Last week we looked at the Profit and Loss, this week we look at the Balance Sheet and undertake a quarterly review of your actual Q1 results compared to the budget and prior year.

Your Accountant or CFO or Virtual CFO should be providing you with your management reports and analysis within a week following month-end in a concise but comprehensive slide deck of six or seven slides/pages. The Balance Sheet will be one of the slides in the slide deck, which should be presented and discussed at your management review meeting.

BALANCE SHEET

The Balance Sheet is a report that shows ‘what you own’ and ’what you owe’ at a point in time, ie September 30th in this case. What you own are your Assets, and what you owe are your Liabilities and Shareholder’s Equity.

blog-33-balance-sheet-scales

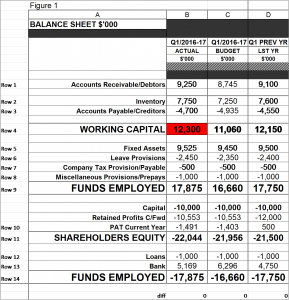
Back in Newsletter 19, you created your Budget Balance Sheet. Using that same format, below is an example of a Balance Sheet slide showing actual values as the end of Q1/2016-17 (Column B), Budget for end Q1 (Column C) and then the actual values as at the end of Q1 for the Prior Year (Column C); refer Figure 1 below. Graphs and charts can also be used for illustration purposes.

Each line of your Balance Sheet should be reviewed by your Accountant or CFO in the first instance comparing budget and prior year figures and flagging exceptions. TIP: I use a colour code system of RED (PROBLEM), ORANGE (WARNING) and GREEN (GREAT) as an effective flag for exceptions (refer Figure 1).

By understanding the assumptions on which the budget Balance Sheet numbers have been derived, you should be able to understand why your actual Balance Sheet figures vary to the budget. Key numbers such as Working Capital should have particular attention, refer Row 4 in Figure 1 below.

Ratios are also an excellent way to identify the health of your Balance Sheet. Some good examples include Stock Turns (if a product based business); Debtors Days Outstanding; Working Capital %; Quick Asset ratio, Return On Funds Employed (ROFE). Your Accountant or CFO should be across the best ratios to use for your particular business.

blog-33-balance-sheet

That is the beauty of Accounting and the ‘numbers’. When you understand what is behind them, you become more aware of issues in your business and can address them and measure the impact of your actions.

SUMMARY

Use this week to understand and analyse your Balance Sheet as at the end of Q1 to provide a sound foundation for business success.

NEXT WEEK

Next week will move to the third Q1 report, a Cash Flow statement.

Ross – Billson Advisory

Business Blog No 32 – Q1 Profit and Loss

The end of the first quarter of the 2016/17 financial year signals a change in focus for my blog. We circle back to the phased budget we prepared earlier in the series and do our quarterly review of your actual Q1 results compared to the budget and prior year.

Your Accountant or CFO or Virtual CFO or Part-Time CFO should be providing this management reporting and analysis within a week following month-end. The timeliness, interpretation and understanding of the numbers are key, and exceptions should be noted or flagged early for explanation and/or remedial action if required.

In my experience, the financials should be presented in a concise but comprehensive slide deck of six or seven slides/pages. As a guide, try having the P&L and related reporting taking 5 slides, and one slide each for the Balance Sheet and Cashflow. The slide deck should be presented and discussed at a monthly management meeting.

PROFIT AND LOSS

This week we will look at the Profit and Loss statement. The following assumes a manufacturing entity, but is easily translatable to any entity for reporting purposes by ignoring irrelevant lines such as materials.

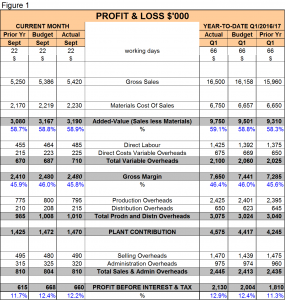
Ideally your P&L reporting should be in a format which shows actual month and quarter numbers alongside budget month/quarter and prior year month/quarter per the illustration following in Figure 1. Graphs can also be used to illustrate the story too for as the saying goes ‘a picture tells a thousand words’.

Each line of your P&L should be reviewed by your Accountant or CFO in the first instance comparing budget and prior year figures and flagging exceptions (TIP: I use a colour code system of RED and GREEN as an effective flag for exceptions).

blog-32-spreadsheet

Looking at the details.

SALES

The Sales numbers require a drill down analysis which is a Price-Volume-Mix Variance analysis by category or segment. This should be the second page of your P&L Report and will help explain any variation in sales between actual, budget and prior year.

MATERIALS AND ADDED VALUE

An analysis should be undertaken to understand the material numbers and ratios for such things as Material Purchase Price Variances, Material Scrap and Usage Variances, Stocktake Variances and exchange rate variances for imported materials. With this information, combined with the sales analysis above, you should be in a position to understand what is driving these numbers and why they vary in comparison to the budget and prior year figures.

DIRECT LABOUR AND VARIABLE OVERHEADS

As with materials, you need to further analyse the direct labour numbers and drill down into things such as non-productive time, overtime, labour efficiency and even labour rate variances. It is the same with variable overheads; you need to get into the detail to understand the exceptions and the bigger picture.

GROSS MARGIN

Again, by using all the information and analysis gathered above, you should be able to explain the gross margin variances and also the % variances.

PRODUCTION, DISTRIBUTION, SELLING and ADMINISTRATION OVERHEADS

A dissection of the overheads incurred by the business should be listed in another report with a ‘dice-and-slice’ by department included in the report. Again exceptions need to be flagged and understood.

 PROFIT BEFORE INTEREST AND TAX (PBIT)

Having completed the analysis, the story behind your PBIT should be clear. I hope you can see that by diving into each line of the summary P&L, you build up a concise picture of why your actual profit/loss varies to budget and prior year. The numbers are nothing without understanding the story behind them and they can prove to be an insightful and powerful tool for building a sound foundation for business success.

You might notice my slogan that goes my logo is “going beyond the numbers” and that is exactly what you should expect from your key finance personnel.

Next week will move to the Balance Sheet.

Ross – Billson Advisory

Business Blog No 31 – Agri StartUp

This week, I thought I would follow on from the theme of last week’s blog on food and agriculture, and introduce you to the area of Agricultural Technology StartUp, or Ag-Tech. Things such as the commercial application of drone technology, robotics and sensors to the agricultural sector are examples of such ag-tech.

Given the world’s growing population and finite resource availability, agriculture needs to become more productive and innovative to feed the growing population. Agriculture has always been a key industry for Australia and with the opportunities presented by our location and region, and China in particular, our ageing agricultural producer population is seeking to bring scientists and IT professionals to the industry. Along the way inspiring a new generation of agricultural personnel.

blog-31-agri

A new entity has recently been created by a joint venture between the National Farmers Federation and a private equity partner. This new entity creates an Ag-Tech support centre to kick-start start-ups for the sector focussed on developing new agricultural technology.

SproutX

The entity, SproutX, launched recently and is based in Melbourne. It is the first entity of its type in Australia and has received State Government support. It is now accepting applications for its Pre-Accelerator program and will soon be accepting applications for its Accelerator program.

The Pre-Accelerator program is currently open and offers a free 6-week course to prepare start-ups for the Accelerator program itself, by fleshing out ideas, providing mentoring, online lectures and some cash to go towards bringing ag-tech ideas to life.

The Accelerator program itself is backed by a $10million fund. It gives ag-tech start-ups access to all the best practical and mentoring advice, cash grants, distribution opportunities, media, PR and office space in an ag-tech hub with direct access to experts and connections to the agriculture industry. The goal is commercialisation of ag-tech ideas. Applications open in November for this program.

An aside

Ironically, I heard 2016 Casey Cardinia Business of the Year, Australian Fresh Leaf Herbs, co-founder Mr. Jan Vydra speak at a business breakfast last week about the need for evolution of the sector and the challenges of making farming attractive to young entrepreneurs.

The SproutX initiative presents a great opportunity for fledgling agricultural startups to provide a sound foundation for business success, as well as the success of the agricultural sector itself.

Next Week

Due to recent requests, the blog next week will focus on management reporting and analysis covering the end of the first quarter of this current financial year. We will start with the Profit and Loss Report next week.

Ross – Billson Advisory