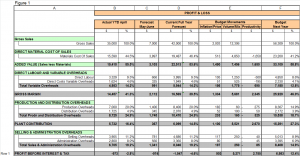
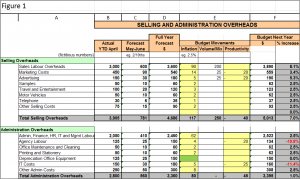
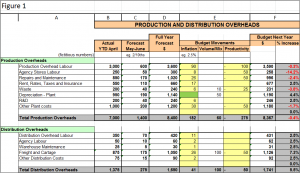
Last week, you finalised your Profit and Loss (P&L) forecast for the current year and budget for the next financial year.
This week, we will look at the phasing of the budget P&L by month so you can use your phased budget to compare actuals results each month.
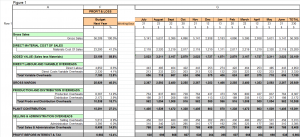
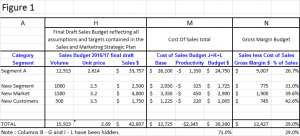
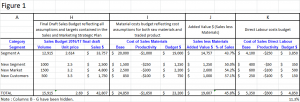
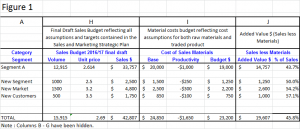
Using your excel spreadsheet model from last week (Figure 1 below), add in another 13 columns representing each month of the new financial year and a total, refer Column G below.
There are a variety of ways of phasing your budgets. Obviously you want to select the method that best allocates budget revenue and costs in the most realistic expected pattern for each category of items in your P&L by month. Some entities plot historical values and mirror the percentage proportion across months in their new budget phasings. Some entities simply divide the full year budget by 12 and use those figures for each month. Some entities allocate across months based on working days by month. Others use seasonal adjustment factors to phase across months. Others use a hybrid version of all of the above.
I recommend that you keep it simple. You want your budget phasing to be reasonably accurate, but it doesn’t have to be precise. Even if you over simplify the phasing, any monthly variations will just be timing variances as every month adds up to the full year totals no matter what method you adopt.
WORKING DAYS PHASING
I recommend using the working days allocation method. This method provides not only the simplicity you seek, but a level of accuracy that is reasonable if your average daily sales values are consistent across the year (and hence are not seasonal) and you incur costs in such a pattern too. Naturally if you are aware that you will generate revenue is a seasonal manner or you will incur certain costs in a differing pattern across the year, make the relevant adjustments to your phasings. An example of costs for which a working day allocation is not reasonable is if you are a manufacturer and you shut down annually to do annual preventative and planned maintenance generally over the Christmas and January period. In this instance, your Repairs and Maintenance (R&M) budget phasing will need to be adapted to reflect the fact that major R&M costs will be incurred when the business is actually closed.
I have simulated the phasing using the working day method as illustrated in the following model (Figure 1, Column G and Row 1). Note that I have assumed that the business is closed 4 weeks per year (spread across December/January and April Easter) for annual leave/shutdown and for 2 weeks of Public Holidays. This leaves the business open 46weeks of the year which equates to 230 working days.
SUMMARY
Use this week to phase your final Profit and Loss Budget by month ready for the new financial year so you can start comparing and measuring actual results each month against your budget each month.
As always, if you need some help or guidance, don’t hesitate to call me on (03) 9554-3128.
Are there any topics you would like me to cover in upcoming blogs? Are there any issues or ‘pain-points’ you would like to see covered?
Ross – Virtual CFO

